


At the time of writing, Bun has over 2,600 open GitHub issues. We love having users and feedback, but some issues are really hard for us to reproduce and debug.
Apps and SaaS products get to use wonderful crash reporting services like Sentry, but for CLI tooling like Bun, uploading core dumps has privacy, performance, and executable size tradeoffs that are harder to justify.
That's why in Bun v1.1.5, I wrote a compact new format for Zig and C++ crash reports. The crash report fits in a ~150 byte URL containing zero personal information.
Why not just use the OS crash reporter?
Some operating systems like macOS have built-in crash reporters, but that usually means shipping debug symbols with the application. For Linux, these debug symbols are around 30 MB and macOS around 9 MB.
du -h ./bun60M ./bunllvm-strip bundu -h ./bun51M ./bunAnd on Windows, the .pdb file is over 250 MB
(gi bun.pdb).Length / 1mb252.4492187530 MB - 250 MB is a huge amount of bloat to add to every install of Bun.
But without debug symbols, crashes are pretty limited. And with Address space layout randomization in the mix, all of the function addresses are made useless.
uh-oh: reached unreachable code
bun will crash now 😭😭😭

----- bun meta -----
Bun v1.1.0 (5903a614) Windows x64
AutoCommand:
Builtins: "bun:main"
Elapsed: 27ms | User: 0ms | Sys: 0ms
RSS: 91.69MB | Peak: 91.69MB | Commit: 0.14GB | Faults: 22579
----- bun meta -----

Search GitHub issues https://bun.sh/issues or join in #windows channel in https://bun.sh/discord

thread 104348 panic: reached unreachable code
???:?:?: 0x7ff62a629f17 in ??? (bun.exe)
???:?:?: 0x7ff62a907a83 in ??? (bun.exe)
???:?:?: 0x7ff62a61f392 in ??? (bun.exe)
???:?:?: 0x7ff62ade7ff1 in ??? (bun.exe)
???:?:?: 0x7ff62ab2193c in ??? (bun.exe)
???:?:?: 0x7ff62ab21166 in ??? (bun.exe)
???:?:?: 0x7ff62cd3ddeb in ??? (bun.exe)
???:?:?: 0x7ff62b7a4bb6 in ??? (bun.exe)
???:?:?: 0x7ff62b7a33bd in ??? (bun.exe)
???:?:?: 0x1bab9ca115d in ??? (???)
???:?:?: 0x1bab9ca111f in ??? (???)
The new crash reporter
In Bun v1.1.5, when a crash or panic occurs, Bun prints a message like this:
Bun v1.1.5 (0989f1a) Windows x64
Args: "C:\Users\chloe\.bun\bin\bun.exe", ".\crash.js"
Builtins: "bun:main"
Elapsed: 40ms | User: 15ms | Sys: 15ms
RSS: 92.80MB | Peak: 92.80MB | Commit: 0.14GB | Faults: 22857
panic(main thread): Internal assertion failure
oh no: Bun has crashed. This indicates a bug in Bun, not your code.
To send a redacted crash report to Bun's team,
please file a GitHub issue using the link below:
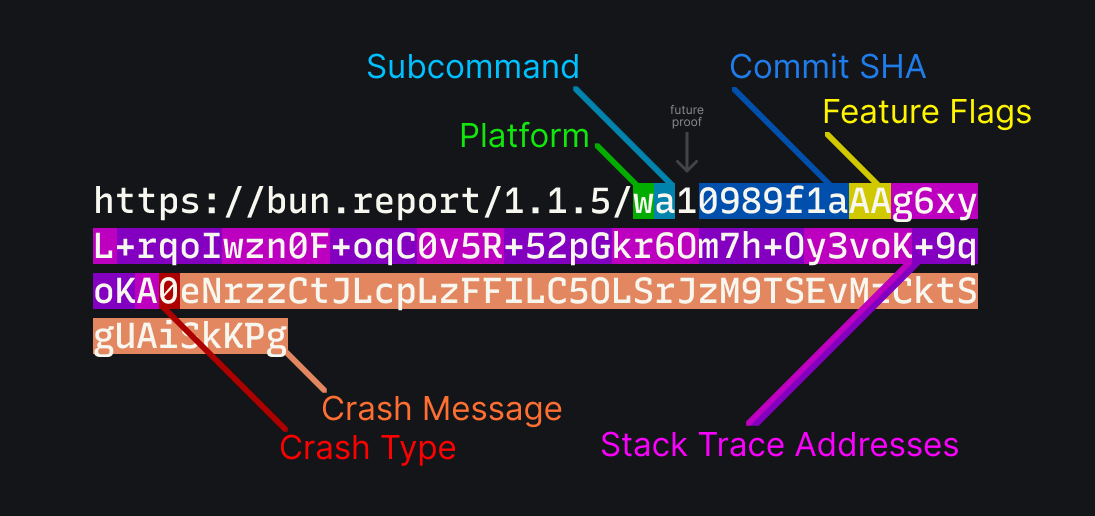
https://bun.report/1.1.5/wa10989f1aAAg6xyL+rqoIwzn0F+oqC0v5R+52pGkr6Om7h+Oy3voK+9qoKA0eNrzzCtJLcpLzFFILC5OLSrJzM9TSEvMzCktSgUAiSkKPg
This bun.report link, when clicked, redirects to open a pre-filled GitHub issue form, with the remapped stack trace encoded in the URL.
Making addresses useful
The function addresses are pointers in memory to where the application code is loaded, which includes a randomized offset for security reasons. This means if we try and demangle these, we get nothing.
llvm-symbolizer --exe ./bun.pdb 0x7ff62a629f17 0x7ff62a907a83??
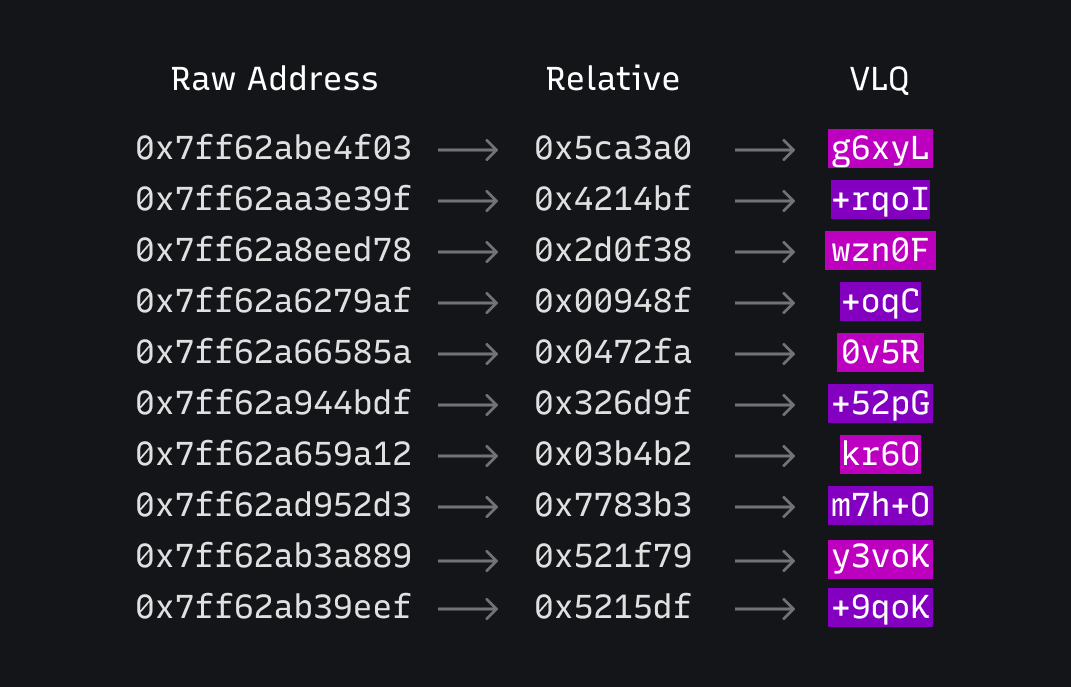
??:0:0The trick is to simply subtract the address from the base address of the binary.
pub fn getRelativeAddress(address: usize) ?usize {
    const module = getModuleFromAddress(address) orelse {
      // Could not resolve address! This can be hit for some
      // Windows internals, as well as JIT'd JavaScript.
      return null;
    };

    return address - module.base_address;
}
In reality, this function is a lot more complicated, as there are different APIs for each platform.
Note – What I referred to as a "module" above is only the case for Windows. It called an "image" on macOS, and a "shared object" on Linux. They all refer to the same concept of a loaded library or executable in memory. For simplicity, I'll continue to refer to them as "modules".
- Windows: Call
GetModuleHandleExWwith theGET_MODULE_HANDLE_EX_FLAG_FROM_ADDRESSflag. The base address is the pointer of the module. - Linux: Use
dl_iterate_phdrto iterate over the loaded modules, once you find one that the raw address is contained in,.dlpi_addron thedl_phdr_infostruct will be the base address. - macOS: The functions
_dyld_image_countand_dyld_get_image_headercan be used to iterate over modules, and then_dyld_get_image_vmaddr_slidegets the ASLR slide.- The resulting address still includes an offset to the image (for Bun it is
0x100000000, can list these in lldb withimage list). To encode a shorter URL, this offset is removed, but it must be re-added before remapping or elsellvm-symbolizerwill fail.
- The resulting address still includes an offset to the image (for Bun it is
For Linux and MacOS, the first module refers to the main application binary. On Windows, you can compare the module's name to peb.ProcessParameters.ImagePathName to determine if it is the main binary.
Normally, once the module and relative address are resolved, the application will immediately open debug symbols and demangle the function. To avoid the cost of downloading and parsing debug symbols, let's offload demangling to a server. This server could cache all of the debug symbols, and demangle stack traces within seconds. At the same time, it can serve as the link to open a new GitHub issue.
bun.report's URL Structure
Let's take another look at this URL, and break down how it is been encoded:
- Platform: A single character indicating the platform.
wis for x86_64 Windows,Mis for aarch64 macOS, and so on. - Subcommand: A single character indicating the subcommand, such as
bun test,bun install, orbun run. - Commit SHA: The commit SHA of the current version of Bun. This is used to fetch debug symbols later.
- Feature Flags: Indicators for what APIs and features were used before Bun crashed.
- Stack Trace Addresses: The addresses calculated earlier.
- Crash Type: A single character indicating the type of crash.
- Crash Message: The message from the crash, the format of this depending on the type.
Note – The version number in the URL is actually just for show. This is so that given just the info above, one can figure out a lot about the crash by hand. For example, you can quickly identify a windows crash by the w platform identifier. Less trivially, you could identify a segmentation fault by looking for A2 near the end of the string.
VLQs are fun
To keep the URL reasonably short, the stack trace addresses are encoded using base64 Variable Length Quantity numbers. This allows small numbers to be encoded with less characters, while still being able to encode large numbers. This is the same technique used in JavaScript source maps for storing line numbers.
The transformation looks like this. Notice how the VLQ encodes smaller addresses as smaller numbers.
The server can decode these back into relative addresses, download debug symbols using the commit hash and platform, and use llvm-symbolizer to demangle the function names.
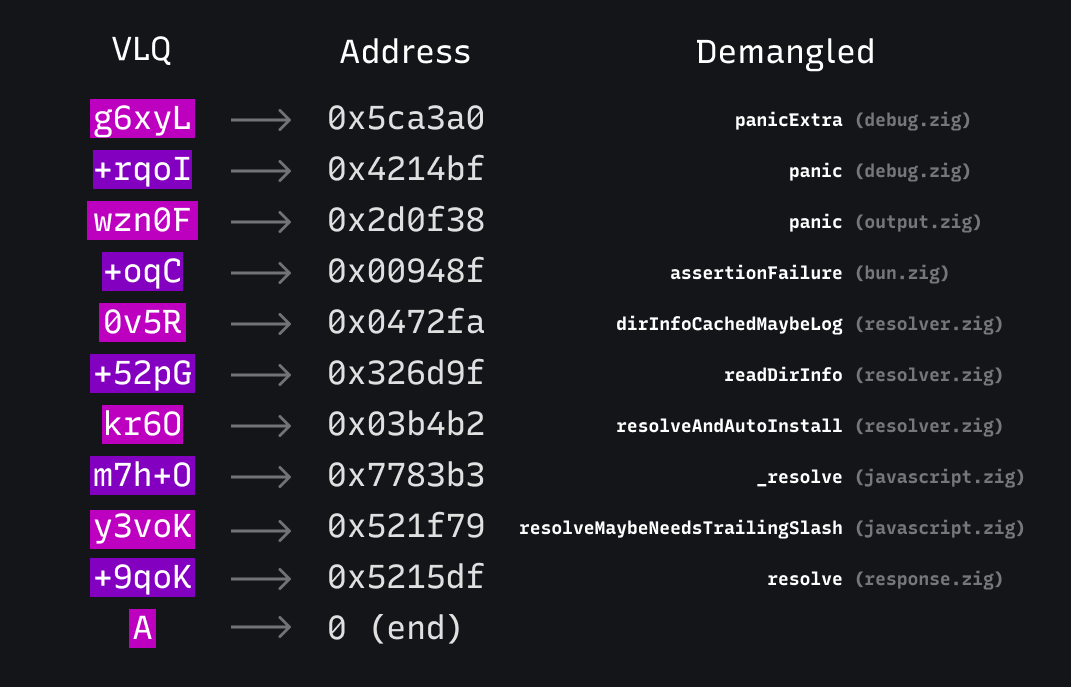
It now becomes plainly obvious what happened: There is a tripped assertion in dirInfoCachedMaybeLog, which came from part of the module resolver code on Windows.
What are "Features"
The URL also encodes a 64-bit integer, where each bit corresponds to if a certain feature in Bun was used. These flags give a hint as to what APIs and systems could have led the crash. For example, the dotenv feature is set when any .env file is automatically loaded, fetch is set when fetch() is used, and so on. (Full list)
Zig's compile-time metaprogramming makes creating this bitfield easy. We already had a container of global variables for tracking features.
pub const Features = struct {
    pub var bunfig: usize = 0;
    pub var http_server: usize = 0;
    pub var shell: usize = 0;
    pub var spawn: usize = 0;
    pub var macros: usize = 0;
    // ... and so on
};
And inside various APIs, we would increment these numbers to mark usage of a feature.
For encoding these into a single u64 integer, we can use std.meta to iterate over the list of features and create a list.
pub const feature_list = brk: {
    const decls = std.meta.declarations(Features);
    var names: [decls.len][:0]const u8 = undefined;
    var i = 0;
    for (decls) |decl| {
        if (@TypeOf(@field(Features, decl.name)) == usize) {
            names[i] = decl.name;
            i += 1;
        }
    }
    const names_const = names[0..i].*;
    break :brk names_const;
};
Then, a packed struct can be created dynamically derivied to use one bit per feature. This structure functions like an integer, but interacts like a struct.
// note: some fields omitted for brevity
pub const PackedFeatures = @Type(.{
    .Struct = .{
        .layout = .@"packed",
        .backing_integer = u64,
        .fields = brk: {
            var fields: [64]StructField = undefined;
            for (feature_list, 0..) |name, i| {
                fields[i] = .{ .name = name, .type = bool };
            }
            fields[feature_list.len] = .{
                .name = "__padding",
                .type = @Type(.{ .Int = .{ .bits = 64 - feature_list.len } }),
            };
            break :brk fields[0..feature_list.len + 1];
        },
    },
});
And finally, when Bun crashes, the bitfield can be constructed very trivially using inline for, a way to iterate over something at compile time, but perform the inner contents at runtime.
pub fn packedFeatures() PackedFeatures {
    var bits = PackedFeatures{};
    inline for (feature_list) |name| {
        if (@field(Features, name) > 0) {
            @field(bits, name) = true;
        }
    }
    return bits;
}
Now, adding a new feature to the original struct Features will properly handle it in the crash reporter, without needing to repeat ourselves.
Doing this sort of thing is possible with C or Rust via macros, but I feel like it's so much simpler and readable with Zig comptime.
How does this compare to a core dump?
Core dumps have a lot more information, but they are massive, need debug symbols to be useful, and include lots of potentially sensitive or confidential information.
We wanted to avoid the possibility of sending any JavaScript/TypeScript source code, environment variables, or other sensitive information in the reports. This is why we only send the Zig/C++ stack trace and a few other details. Instead of sending everything by default, this approach sends only what we (probably) need to diagnose the issue. If we need more information, we can ask the user to provide it, but this is so much better than nothingness of a bunch of unmapped addresses we had before.
Demo
To put it all together, I wrote a small webapp that lets you test out the crash reporter, which is available at the homepage, bun.report. It is also where you end up if you append /view to the end of any crash report URL.
Bun is hiring in San Francisco
If you're interested in working on projects like this, we're hiring engineers in San Francisco! We're looking for systems engineers to help build the future of JavaScript. Apply here