TLDR: Bun implements the v8 heap snapshot API, and Chrome DevTools supports comparing heap snapshots
- Memory leak: Memory usage increases continuously over time without plateauing, even when the workload remains constant.
- High memory usage: Application consumes significant memory but remains stable during operation.
The key indicator of a memory leak is memory usage that continuously climbs without ever decreasing. Remember that in garbage-collected languages like JavaScript, memory usage can appear to grow for some time before the garbage collector runs. True leaks show a consistent upward trend over longer periods.
V8 Heap Snapshots
Bun implements V8's heap snapshot API.
import { writeHeapSnapshot } from "v8";

// Create a named heap snapshot
writeHeapSnapshot("my-application.heapsnapshot");
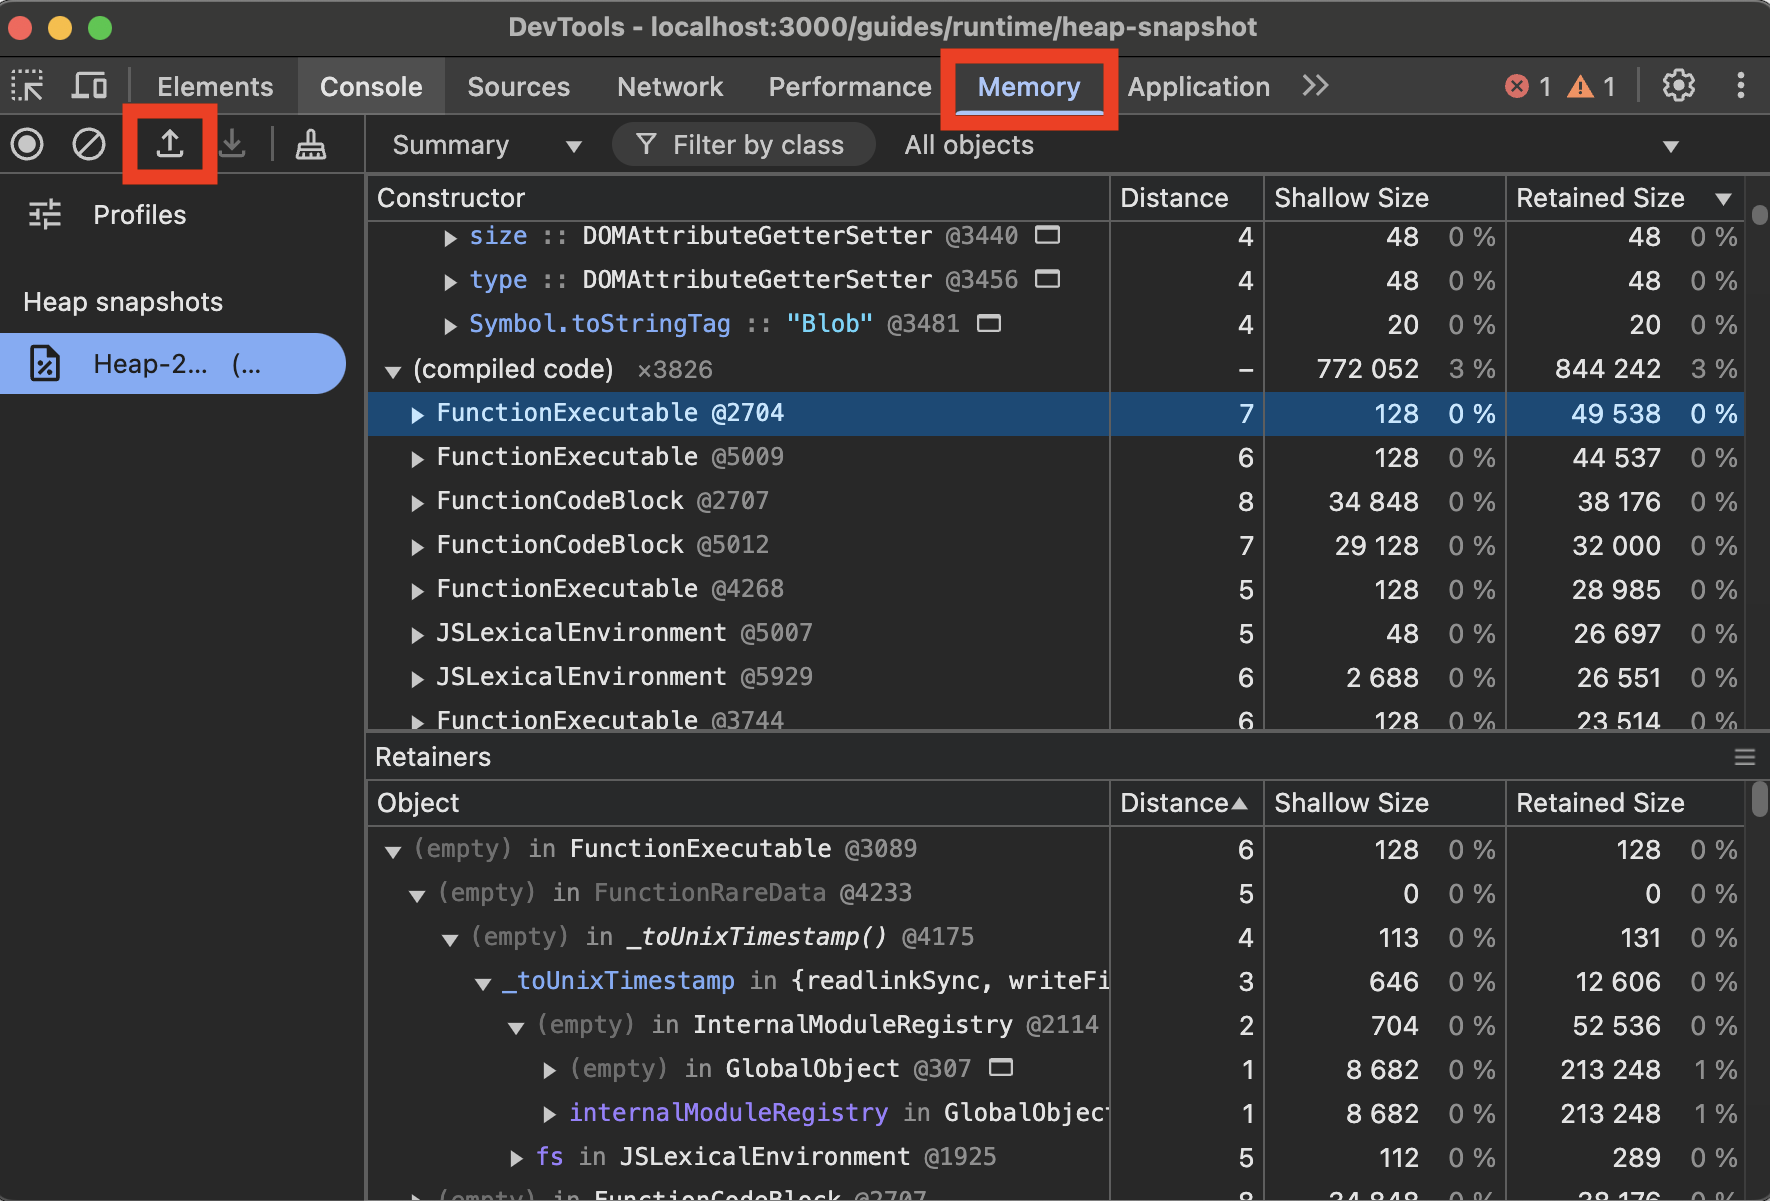
This generates a .heapsnapshot file that can be loaded into Chrome DevTools.

How do I load a heap snapshot?
Heap Snapshot comparison
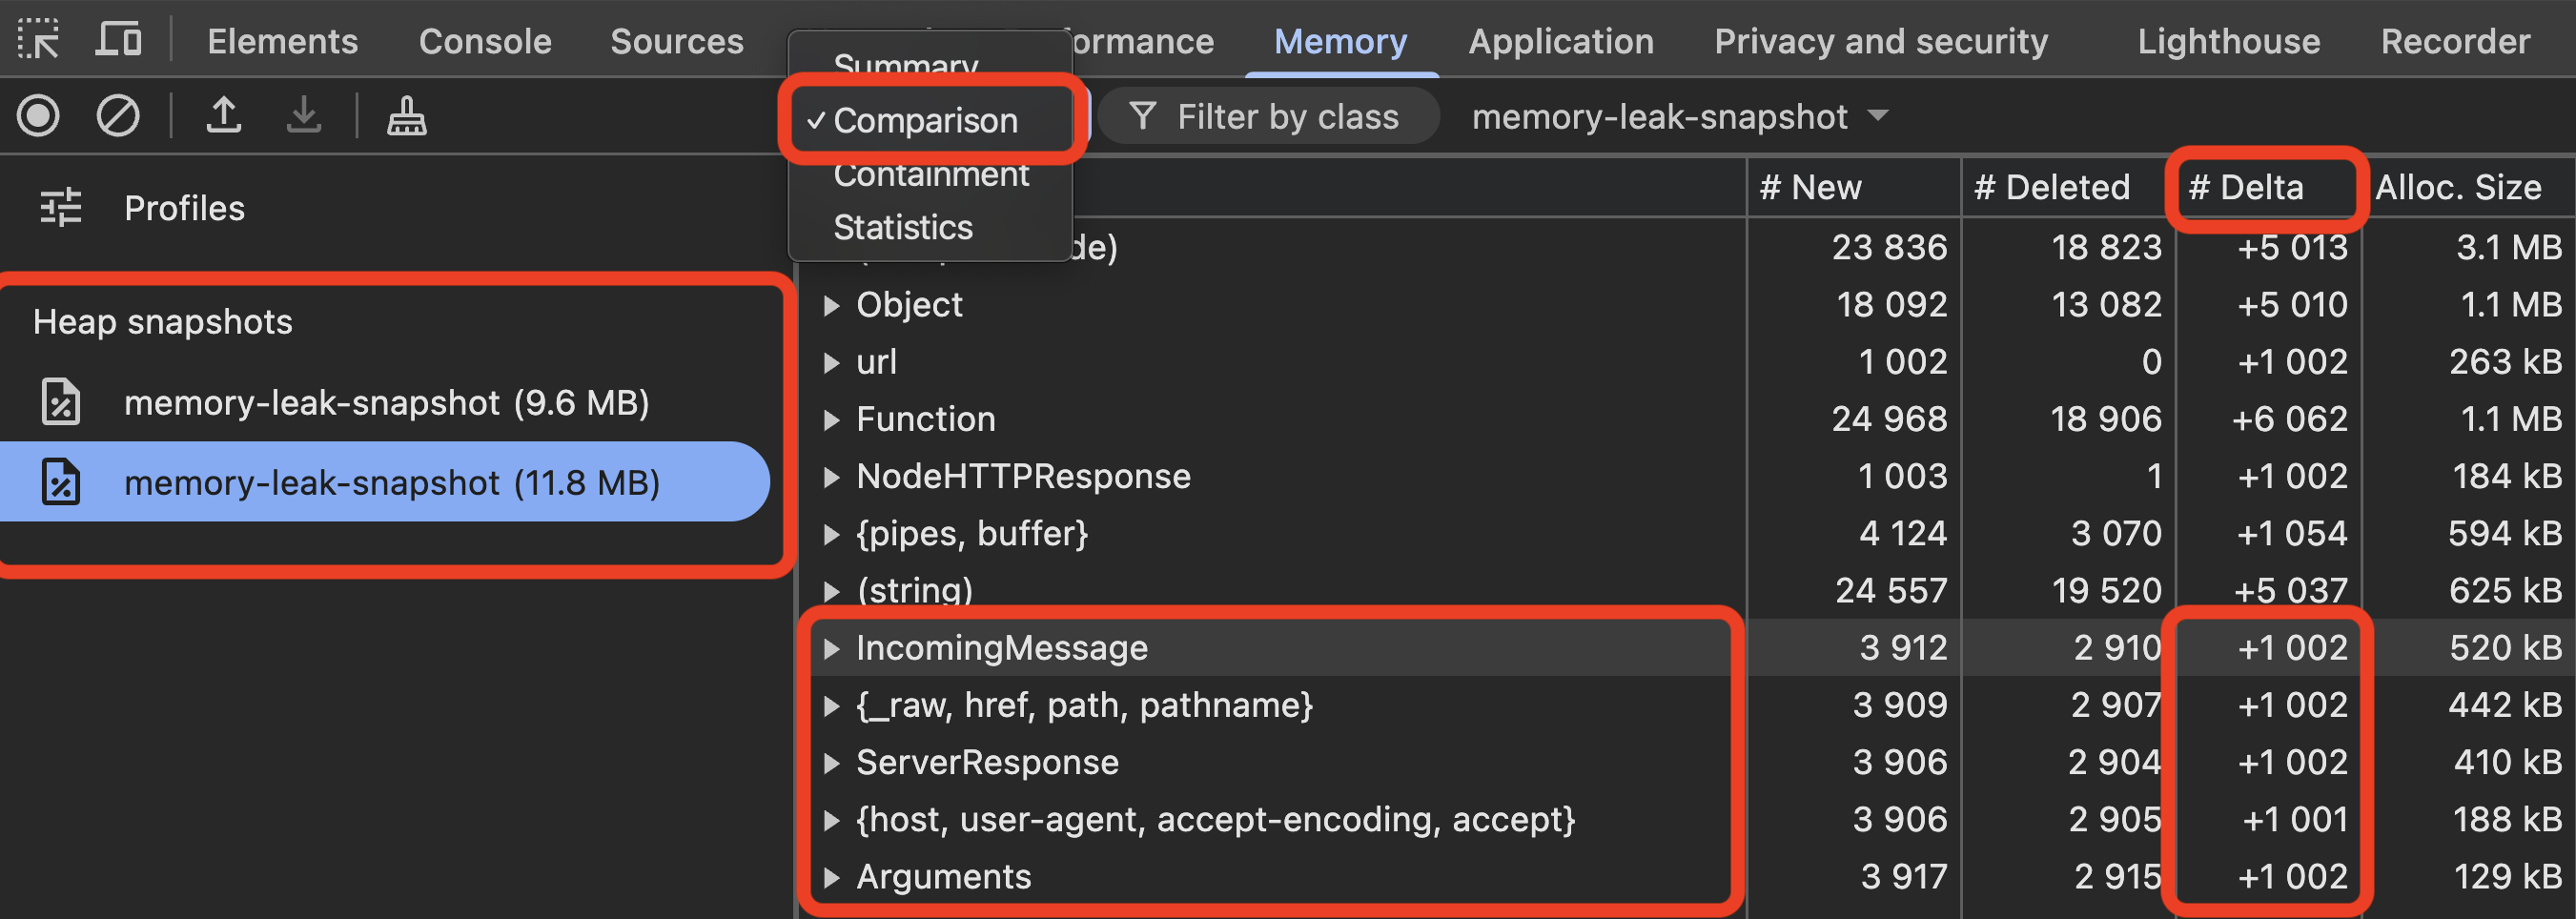
Chrome DevTools supports creating comparisons between multiple heap snapshots.
- Upload multiple
.heapsnapshotfiles to the "Memory" tab - Select the latest snapshot and click "Summary"
- Click "Comparison"

Example code that causes a memory leak
The "Delta" column is particularly useful for identifying memory leaks. When that number increases steadily (and usually not by 10 or 100, but by a very large number), you might have a memory leak.
JavaScriptCore Heap Statistics
Bun provides direct access to JavaScriptCore's heap statistics:
import { heapStats } from "bun:jsc";

// Log JSC heap stats to see memory usage details
console.log(heapStats());
This returns an object containing detailed heap information:
{
  heapSize: 15485760,
  heapCapacity: 16777216,
  extraMemorySize: 2097152,
  objectCount: 42358,
  protectedObjectCount: 8274,
  globalObjectCount: 1,
  protectedGlobalObjectCount: 1,
  objectTypeCounts: {
    "Array": 8732,
    "Object": 12489,
    "Function": 6254,
    "Promise": 2453,
    // many more object types...
  },
  protectedObjectTypeCounts: {
    // protected objects by type...
  }
}
The objectTypeCounts property shows how many objects of each type are in memory. An unusually high number of objects of a particular type can point to potential issues. For example, seeing 10,000+ Promise objects might indicate promises that never resolve or reject.
protectedObjectTypeCounts is similar but only counts objects that are protected from garbage collection, like timers for setTimeout or setInterval.
Measuring memory usage
Use process.memoryUsage.rss() to measure memory usage:
console.log(process.memoryUsage.rss());
This will give you the resident set size, which is the amount of memory actually allocated in RAM for the process.
How is RSS different from Virtual Memory?
RSS is the amount of memory actually allocated in RAM for the process. Virtual memory is the total amount of memory that can be used by the process, including memory that is not currently in RAM. On POSIX systems, memory that is requested but not yet used is not included in RSS and does not impact your overall system memory usage. JavaScriptCore leverage "moats" of virtual memory ranges as barriers between types to limit the blast radius of memory-related security vulnerabilities.
Tips for reducing memory usage
Regardless of whether or not you came here to debug a memory leak, here are some useful tips for reducing memory usage:
Use Blob instead of streams for immutable data
When you pass a Uint8Array or Buffer or ArrayBuffer to new Response we are forced to clone the data into an internal buffer for the lifetime of the Response.
This snippet allocates ~1024 MB of memory:
const ten_megabytes = 10 * 1024 * 1024;
const data = new Uint8Array(ten_megabytes).fill(123);

const responses = [];

// This allocates 1 GB of memory!
for (let i = 0; i < 100; i++) {
  const response = new Response(data);
  responses.push(response);
}

console.log((process.memoryUsage.rss() / 1024 / 1024) | 0, "MB");
When we change the Uint8Array to a Blob, memory usage drops to ~60 MB:
const ten_megabytes = 10 * 1024 * 1024;
const responses = [];
const data = new Blob([new Uint8Array(ten_megabytes).fill(123)]);
const data = new Uint8Array(ten_megabytes).fill(123);

// This allocates 10 MB of memory!
for (let i = 0; i < 100; i++) {
  const response = new Response(data);
  responses.push(response);
}

console.log((process.memoryUsage.rss() / 1024 / 1024) | 0, "MB");
Web streams create many small copies of data that must all be cloned, which exacerbates the problem.
Avoidusing streams unnecessarily
// Creates multiple copies of the data in memory
function handleInput(input) {
  const stream = new ReadableStream({
    start(controller) {
      controller.enqueue(input);
      controller.close();
    },
  });

  // Each of these consumers gets a separate copy
  stream.pipeTo(consumer1);
  stream.pipeTo(consumer2);
}

handleInput("Passing static data to a ReadableStream costs extra memory");
Preferusing Blob for immutable data
// Reuses the same memory for multiple consumers
function handleInput(input) {
  const blob = new Blob([input]);

  // These share the same underlying memory
  consumer1.process(blob);
  consumer2.process(blob);
}
Nullify references when done
When objects have lots of cylical references, you can use undefined or null to break the cycle and help the garbage collector reclaim the memory sooner (or any other value, undefined is not special here).
async function processLargeData() {
  let largeData = loadHugeDataset();
  const result = computeResult(largeData);

  // largeData is still in memory here, even though we don't need it
  // so let's clear it.
  largeData = undefined;

  await doSomethingWithResult(result);

  return result;
}
Common Sources of Memory Leaks
Closure-Related Leaks
Closures that reference large objects or variables from parent scopes retain those objects for the lifetime of the closure:
function setupProcessor() {
  // This large data structure gets captured in the closure
  const dataCache = new Array(1000000).fill(0).map(() => ({
    /* large object */
  }));

  return function process(item) {
    // References dataCache, keeping it alive as long as this function exists
    return dataCache.find((entry) => entry.id === item.id);
  };
}

// This processor function keeps the entire dataCache alive
const processor = setupProcessor();
In JavaScriptCore (and other JavaScript engines likely do similar things), when a closure references variables from parent scopes, it creates an internal object for referencing the scope (JSLexicalScope) and then holds a reference to that. This keeps the scope alive until the closure is garbage collected, which keeps the objects within that scope alive until the closure is garbage collected.
When you use ES modules or CommonJS, anything in the top-level scope of the module may be retained for the lifetime of the module itself, which is usually the entire lifetime of the process. So be careful about what you put in the top-level scope.
AbortSignal and AbortController
An active AbortSignal keeps itself and all registered callbacks alive until the abort event is emitted OR until the resource is no longer active.
How does this work internally?
Long-running HTTP requests, such as when using Server-Sent Events (SSE), can lead to long-running AbortSignal objects that keep a lot of objects alive.
function fetchData() {
  // Create a controller for this operation
  const controller = new AbortController();
  const { signal } = controller;

  // This large data is kept alive as long as the signal is active
  const processingContext = createHugeObject();

  // The abort listener keeps processingContext alive
  signal.addEventListener("abort", () => {
    cleanupProcessing(processingContext);
  });

  // The `processingContext` is kept alive as long as the signal is active
  fetch("https://api.example.com/data", { signal })
    .then((response) => processResponse(response, processingContext))
    .catch((err) => {
      if (!signal.aborted) {
        // Handle error but don't abort
      }
    });

  // Return the controller so it can be aborted externally
  return controller;
}

fetchData();
TLDR: Avoid referencing large data structures in abort event listeners
// Self-aborting after 30 seconds
const signal = AbortSignal.timeout(30_000);

fetch("https://api.example.com/data", { signal })
  .then((response) => processResponse(response))
  .catch((err) => {
    if (err.name === "AbortError") {
      console.log("Request timed out");
    }
  });
Function.prototype.bind() Retaining Objects
When you bind a function to a this value, both the function and bound values remain in memory until the bound function is garbage collected:
class ResourceManager {
  constructor() {
    this.resources = new Array(10000).fill().map(() => new Resource());

    // This bound function keeps 'this' (and all its resources) alive
    this.getResourceCount = this.getResourceCount.bind(this);
    globalRegistry.registerCallback(this.getResourceCount);
  }

  getResourceCount() {
    return this.resources.length;
  }
}
This is often better than referencing variables from outer scopes since the references are kept solely to the specific variables in use at the time of binding (instead of creating a new JSLexicalScope object), but it can still cause memory leaks if not used carefully.
EventEmitter Listeners Without Cleanup
EventEmitter can cause memory leaks when listeners aren't properly removed:
import { EventEmitter } from "node:events";

function setupDataProcessor(emitter) {
  const largeData = loadLargeDataset(); // Potentially megabytes of data

  // This listener keeps largeData in memory as long as emitter exists
  emitter.on("process", (item) => {
    const result = processWithLargeData(item, largeData);
    emitter.emit("result", result);
  });

  // Without a corresponding emitter.removeListener call,
  // largeData will never be garbage collected until the emitter itself is garbage collected
}

const globalEmitter = new EventEmitter();
setupDataProcessor(globalEmitter);
Use once() for one-time events or explicitly remove listeners when they're no longer needed:
// For one-time events
emitter.once("process", handler);

// For multiple events that need cleanup
const handler = (item) => {
  /* ... */
};
emitter.on("process", handler);

// When done with the listener
emitter.removeListener("process", handler);